Event Analytics
You want to show analytics to a client, a board member, or the public — without handing out credentials or exposing your admin dashboard. HitKeep share links give read-only access to a single site’s analytics. You create them, you revoke them, your server serves them. No third-party service involved.
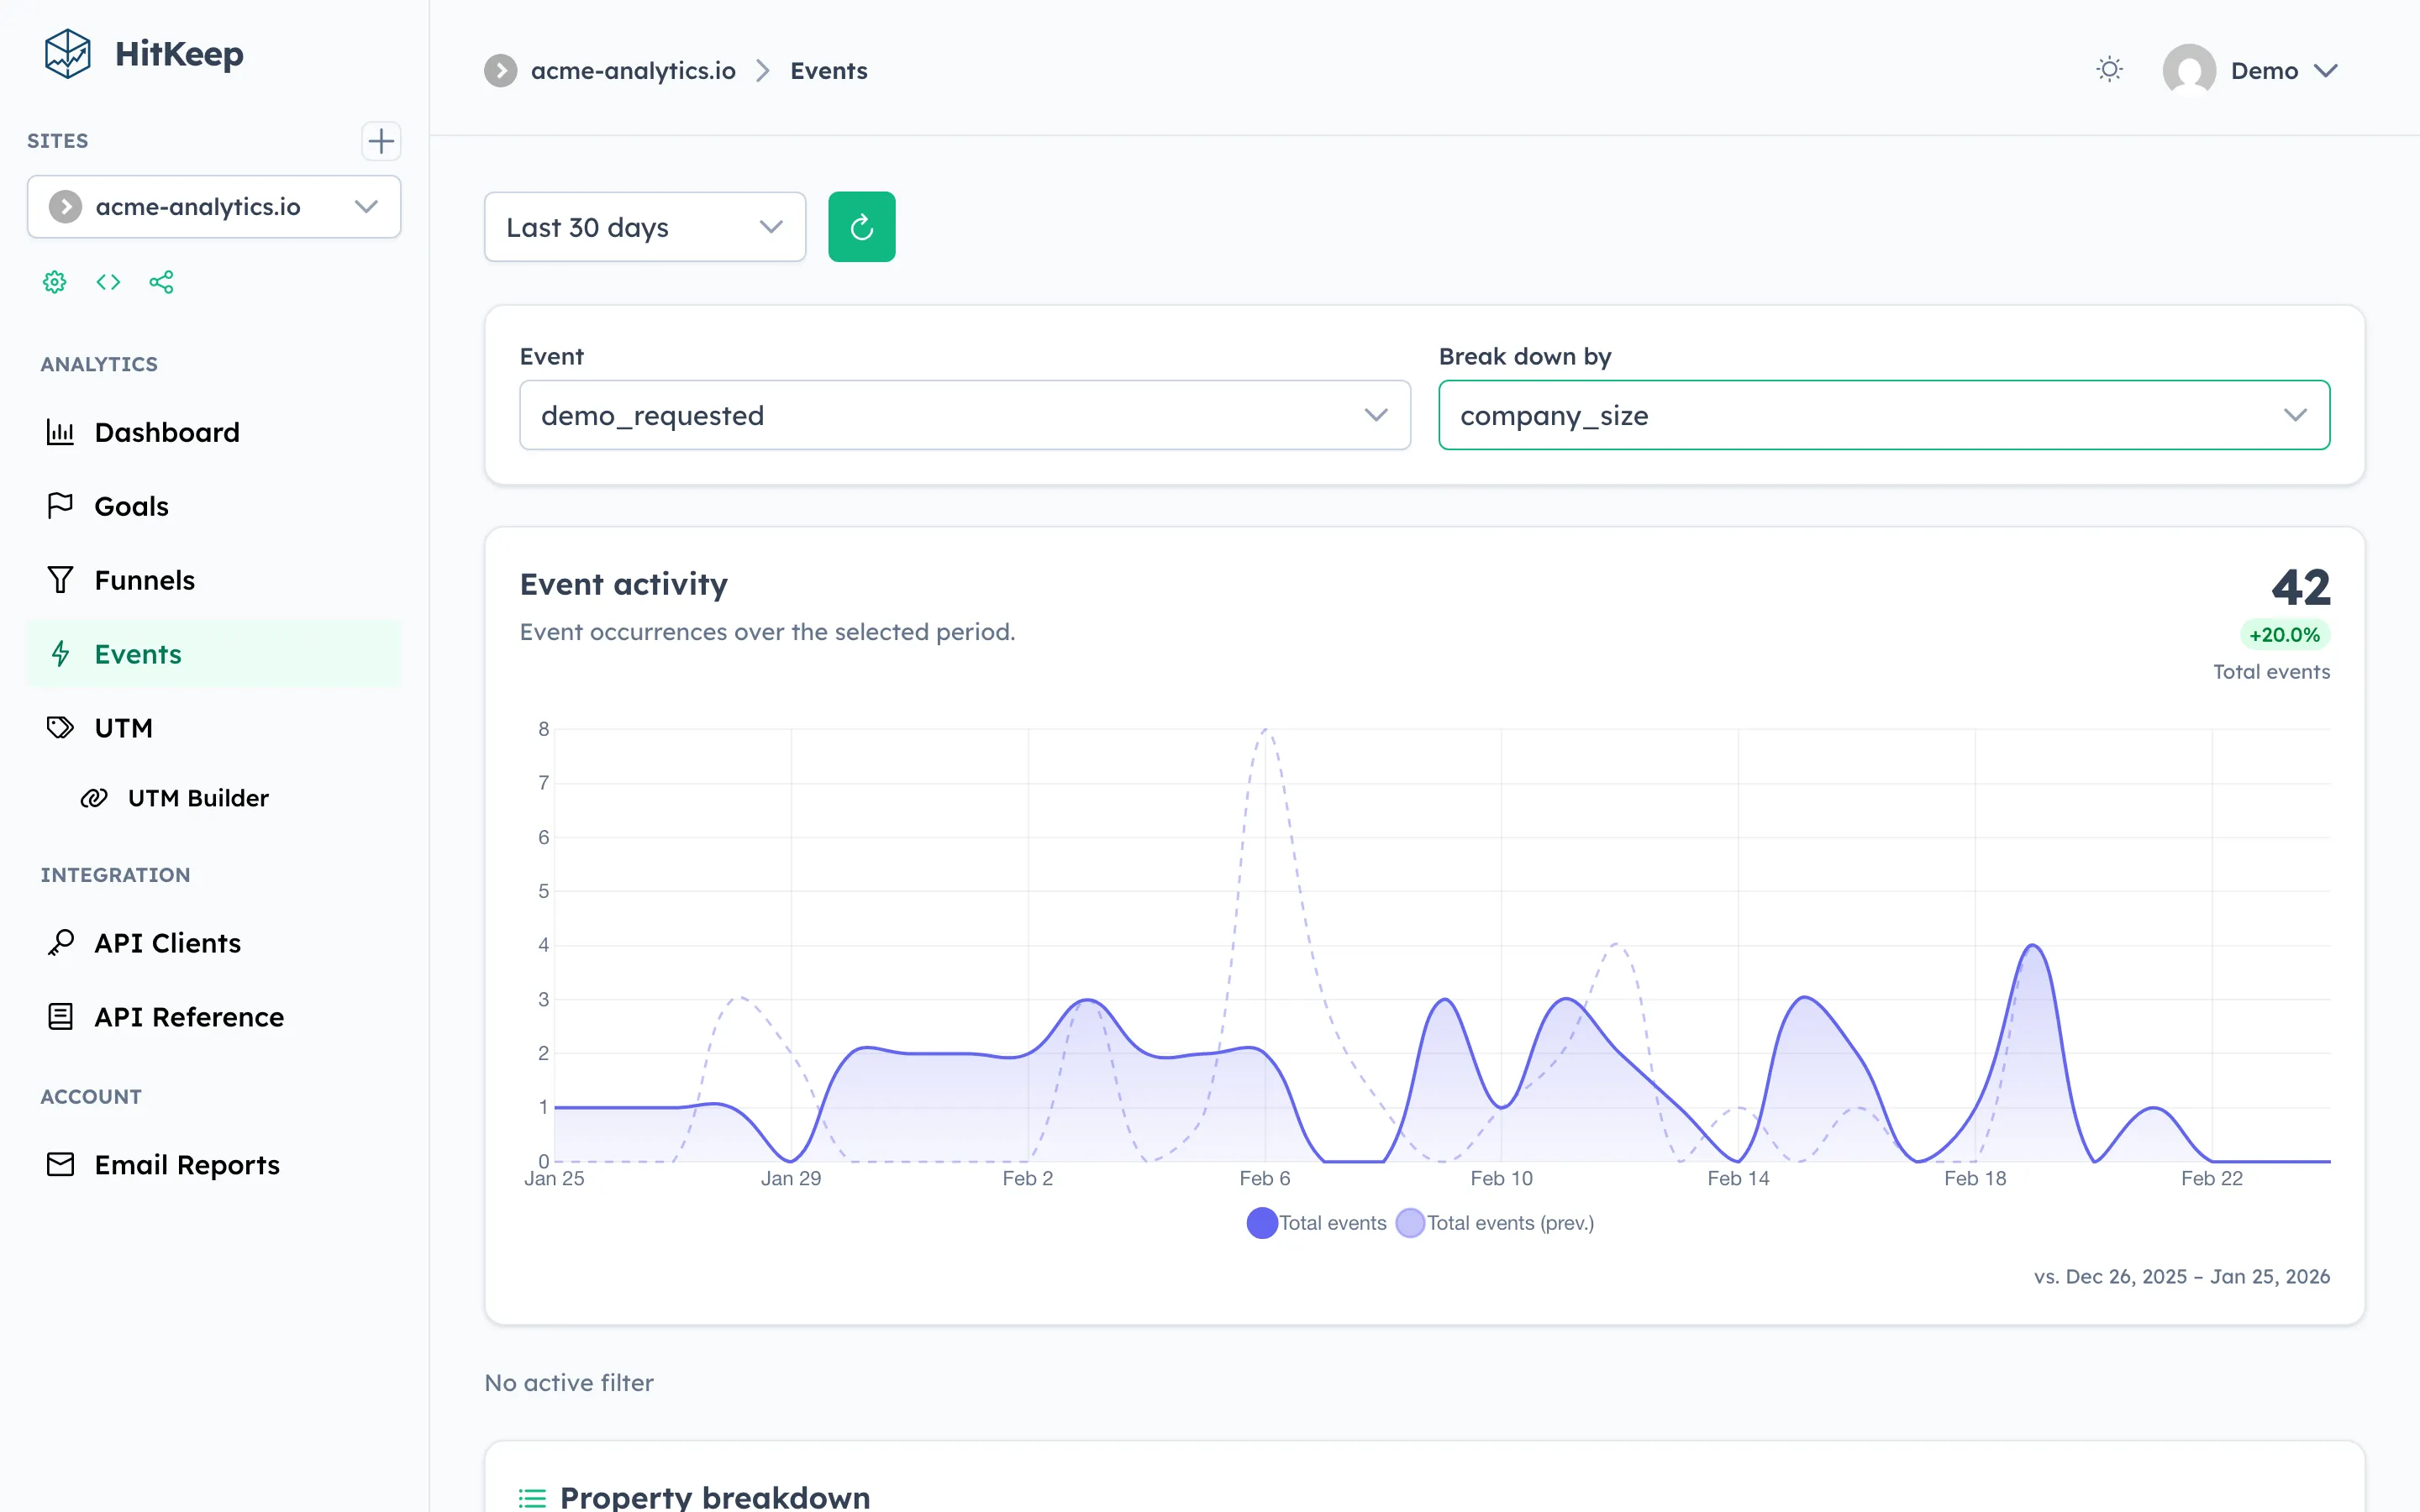
You fire custom events from your site using the HitKeep tracker. The Events page turns those events into actionable insight: slice any event by its JSON properties, filter the chart by country/device/page/referrer, and immediately see the audience behind each event — all without writing SQL.
Prerequisites
Section titled “Prerequisites”Custom events must be tracked using the HitKeep snippet:
window.hk('purchase_completed', { plan: 'pro', billing: 'annual', amount: 99 });See the tracking reference for full details.
Using the Events Page
Section titled “Using the Events Page”1. Select an event and property
Section titled “1. Select an event and property”- Navigate to Events in the sidebar.
- Select a time range from the toolbar.
- Pick an event name from the first dropdown — the list is populated from events recorded in the selected range.
- Optionally pick a property from the second dropdown — the list shows all keys present on that event.
- The Property breakdown table appears with one row per distinct value, ordered by unique-session count descending.
Click any row in the breakdown table to filter the chart to only sessions that had that property value. Click the row again to clear the filter. Active filters appear as pill chips below the chart — click the × button on a chip or Clear all to remove them.
2. Audience panels
Section titled “2. Audience panels”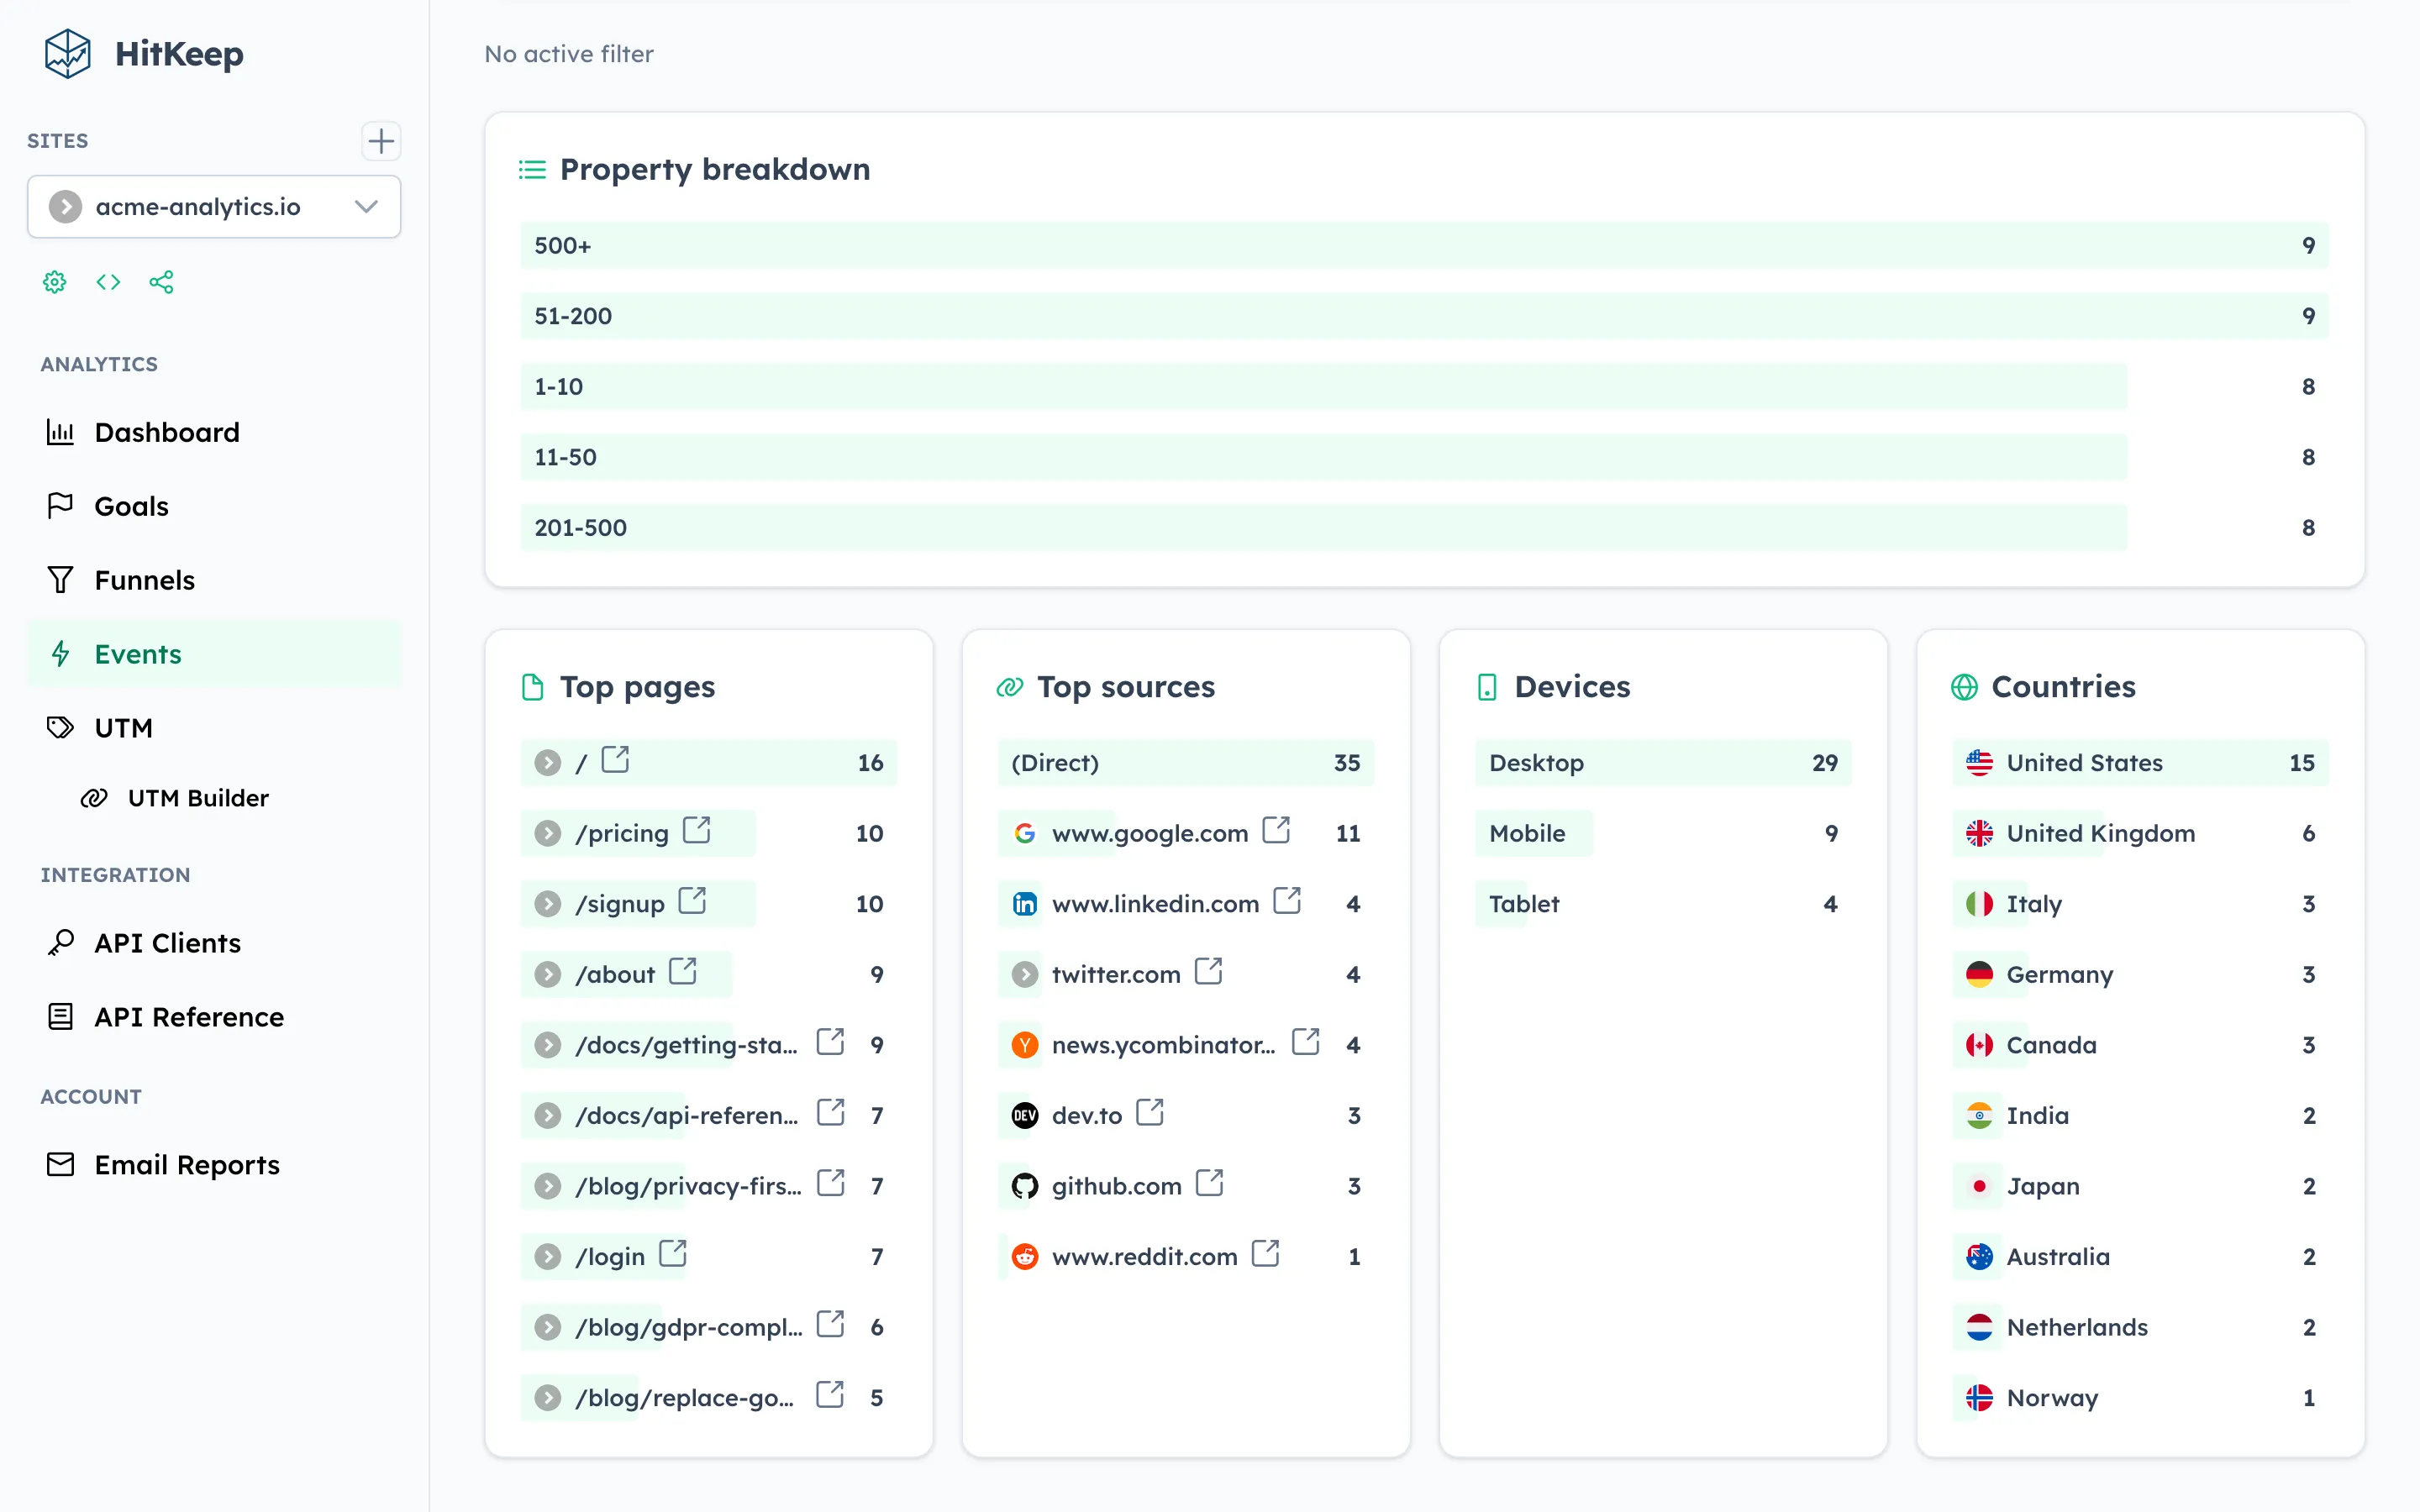
When an event is selected, four audience panels appear below the breakdown table:
| Panel | What it shows |
|---|---|
| Top pages | Pages visited during sessions that contain the selected event |
| Top sources | Referrers for those sessions |
| Devices | Desktop vs. Mobile breakdown |
| Countries | Country distribution |
All counts are unique sessions — consistent with the property breakdown table.
Click any row in an audience panel to add an audience filter. This restricts both the timeseries chart and the other audience panels to sessions that match. For example, clicking “Germany” in the Countries panel shows the event trend for German visitors only. Click the row again, or use the filter chips bar, to remove the filter.
3. Combining filters
Section titled “3. Combining filters”You can have up to two active filters simultaneously — one property-value filter and one audience-dimension filter. Both are shown as pill chips below the chart:
plan: pro × Country: DE × Clear allBoth filters are applied together (AND logic): the chart shows events where plan = pro AND the session country is Germany.
# List event names for a site and time rangeGET /api/sites/{id}/events/names?from=2025-01-01T00:00:00Z&to=2025-01-31T23:59:59Z
# List property keys for a specific eventGET /api/sites/{id}/events/properties?from=...&to=...&event_name=purchase_completed
# Breakdown of a property across an eventGET /api/sites/{id}/events/breakdown?from=...&to=...&event_name=purchase_completed&property_key=plan
# Event timeseries — optionally filtered by property or audience dimensionGET /api/sites/{id}/events/timeseries?from=...&to=...&event_name=purchase_completedGET /api/sites/{id}/events/timeseries?...&property_key=plan&property_value=proGET /api/sites/{id}/events/timeseries?...&dimension_key=country&dimension_value=DE
# Audience breakdown for an eventGET /api/sites/{id}/events/audience?from=...&to=...&event_name=purchase_completedGET /api/sites/{id}/events/audience?...&property_key=plan&property_value=proGET /api/sites/{id}/events/audience?...&dimension_key=country&dimension_value=DE
dimension_key accepts: path, referrer, device, country.
All endpoints require Site Viewer access (session cookie, bearer token, or API key).
Seed data
Section titled “Seed data”Run ./hitkeep seed and navigate to Events → purchase_completed → plan to see the full breakdown and audience panels populated immediately with seeded demo data.