
Stakeholders rarely need more Google data. They need clearer decisions.
Most teams end up with a dashboard set that is technically rich but hard to act on: one view for SEO, one for marketing, one for executives, and a lot of unannotated changes. Better reporting starts by building one clear decision system, not a bigger set of charts.
Start with the audience, not the dashboard
Each stakeholder asks a different decision question. A single combined view rarely works for everyone.
| Stakeholder | Primary question | Best reporting angle | Metric focus |
|---|---|---|---|
| Executive team | Are we moving in the right direction? | Outcomes and risk | Conversions, conversion quality, qualified traffic mix |
| Marketing leadership | Which channels need more or less focus? | Channel outcomes and quality | Sources, assisted conversions, landing-page performance |
| SEO team | Is search demand improving in meaningful ways? | Discovery and relevance | Queries, clicks, CTR, indexed pages |
| Content team | Which pages are helping and which are stalling? | Content-to-outcome paths | Entrances, engagement, conversion steps |
| Agency or consultant | What changed from this period? | Before/after decision evidence | Baselines, annotations, uplift, recommendations |
This mapping should drive every report section. If a chart does not help someone make a decision, move it to an appendix.
Build a reporting narrative before selecting charts
A stakeholder report should follow a consistent order: status, causes, risks, actions.
For example, do not start with traffic and hope the reader infers impact. Start with a simple interpretation:
- Traffic mix improved, but growth is driven by informational demand,
- conversion contribution stayed flat,
- next actions should focus on pages and channels that move qualified outcomes.
Use the same flow every cycle:
- What changed in outcomes?
- Which source explained the change?
- Which decision should happen next?
Use Search Console as discovery context, not a complete story
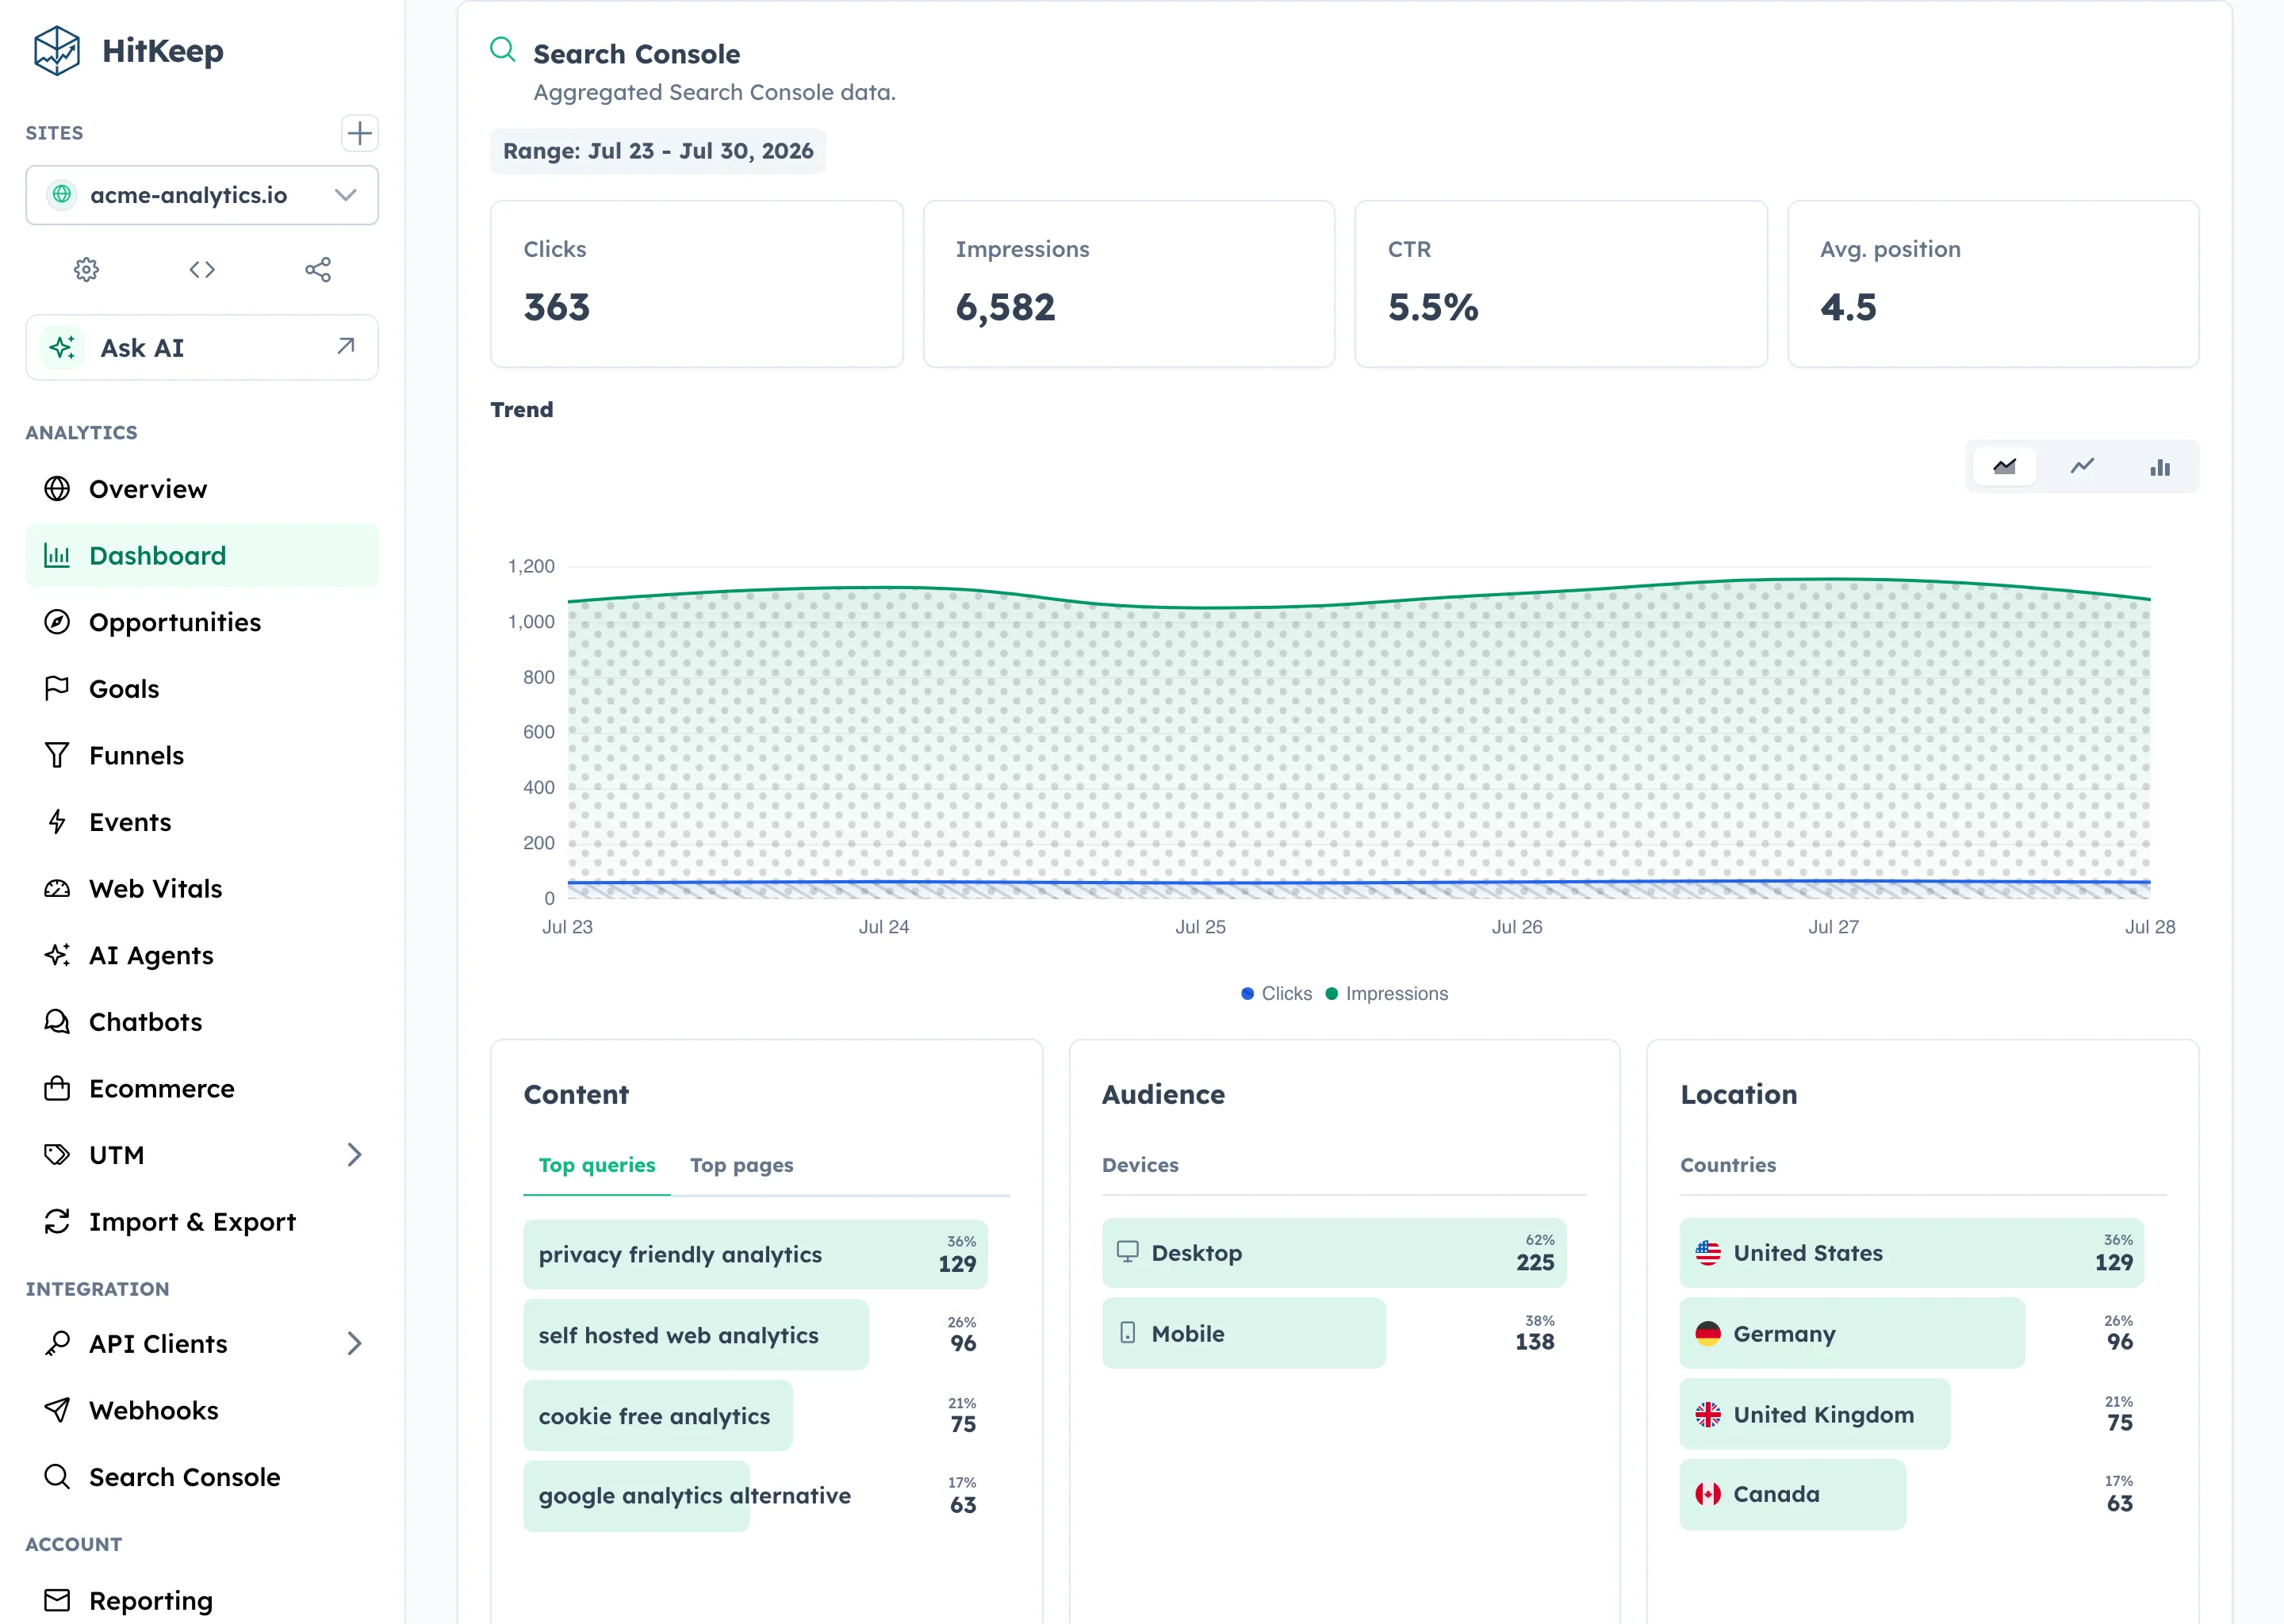
Search Console is often treated as an SEO utility. It is better used as a demand context layer.
Use it to track:
- search demand and click-through changes,
- query intent shifts,
- and landing-page intent gaps between discovery and conversion.
But do not treat it as the whole report. It does not answer what happens after a click. Pair it with on-site analytics and outcome metrics so your team can connect demand to business results.
Suggested Search Console reporting structure
- Demand layer: impressions, clicks, CTR, and query intent.
- Bridge layer: landing pages, engagement, campaign context.
- Outcome layer: conversions, funnel completion, and business value.
That structure shows whether search visibility is producing outcomes or only activity.
Keep definitions stable across GA and analytics signals
If every team uses a different definition of “users,” “sessions,” or “conversion,” trust decays quickly.
| Metric | Recommended definition |
|---|---|
| Visits or sessions | A bounded interaction path in your chosen measurement model |
| Engaged sessions | A session meeting the engagement criteria in your platform |
| Conversion | A named outcome approved by the reporting owner |
| Channel mix | Source attribution policy, documented per channel |
Document definitions in the report before publishing results.
Separate traffic signals that mean different things
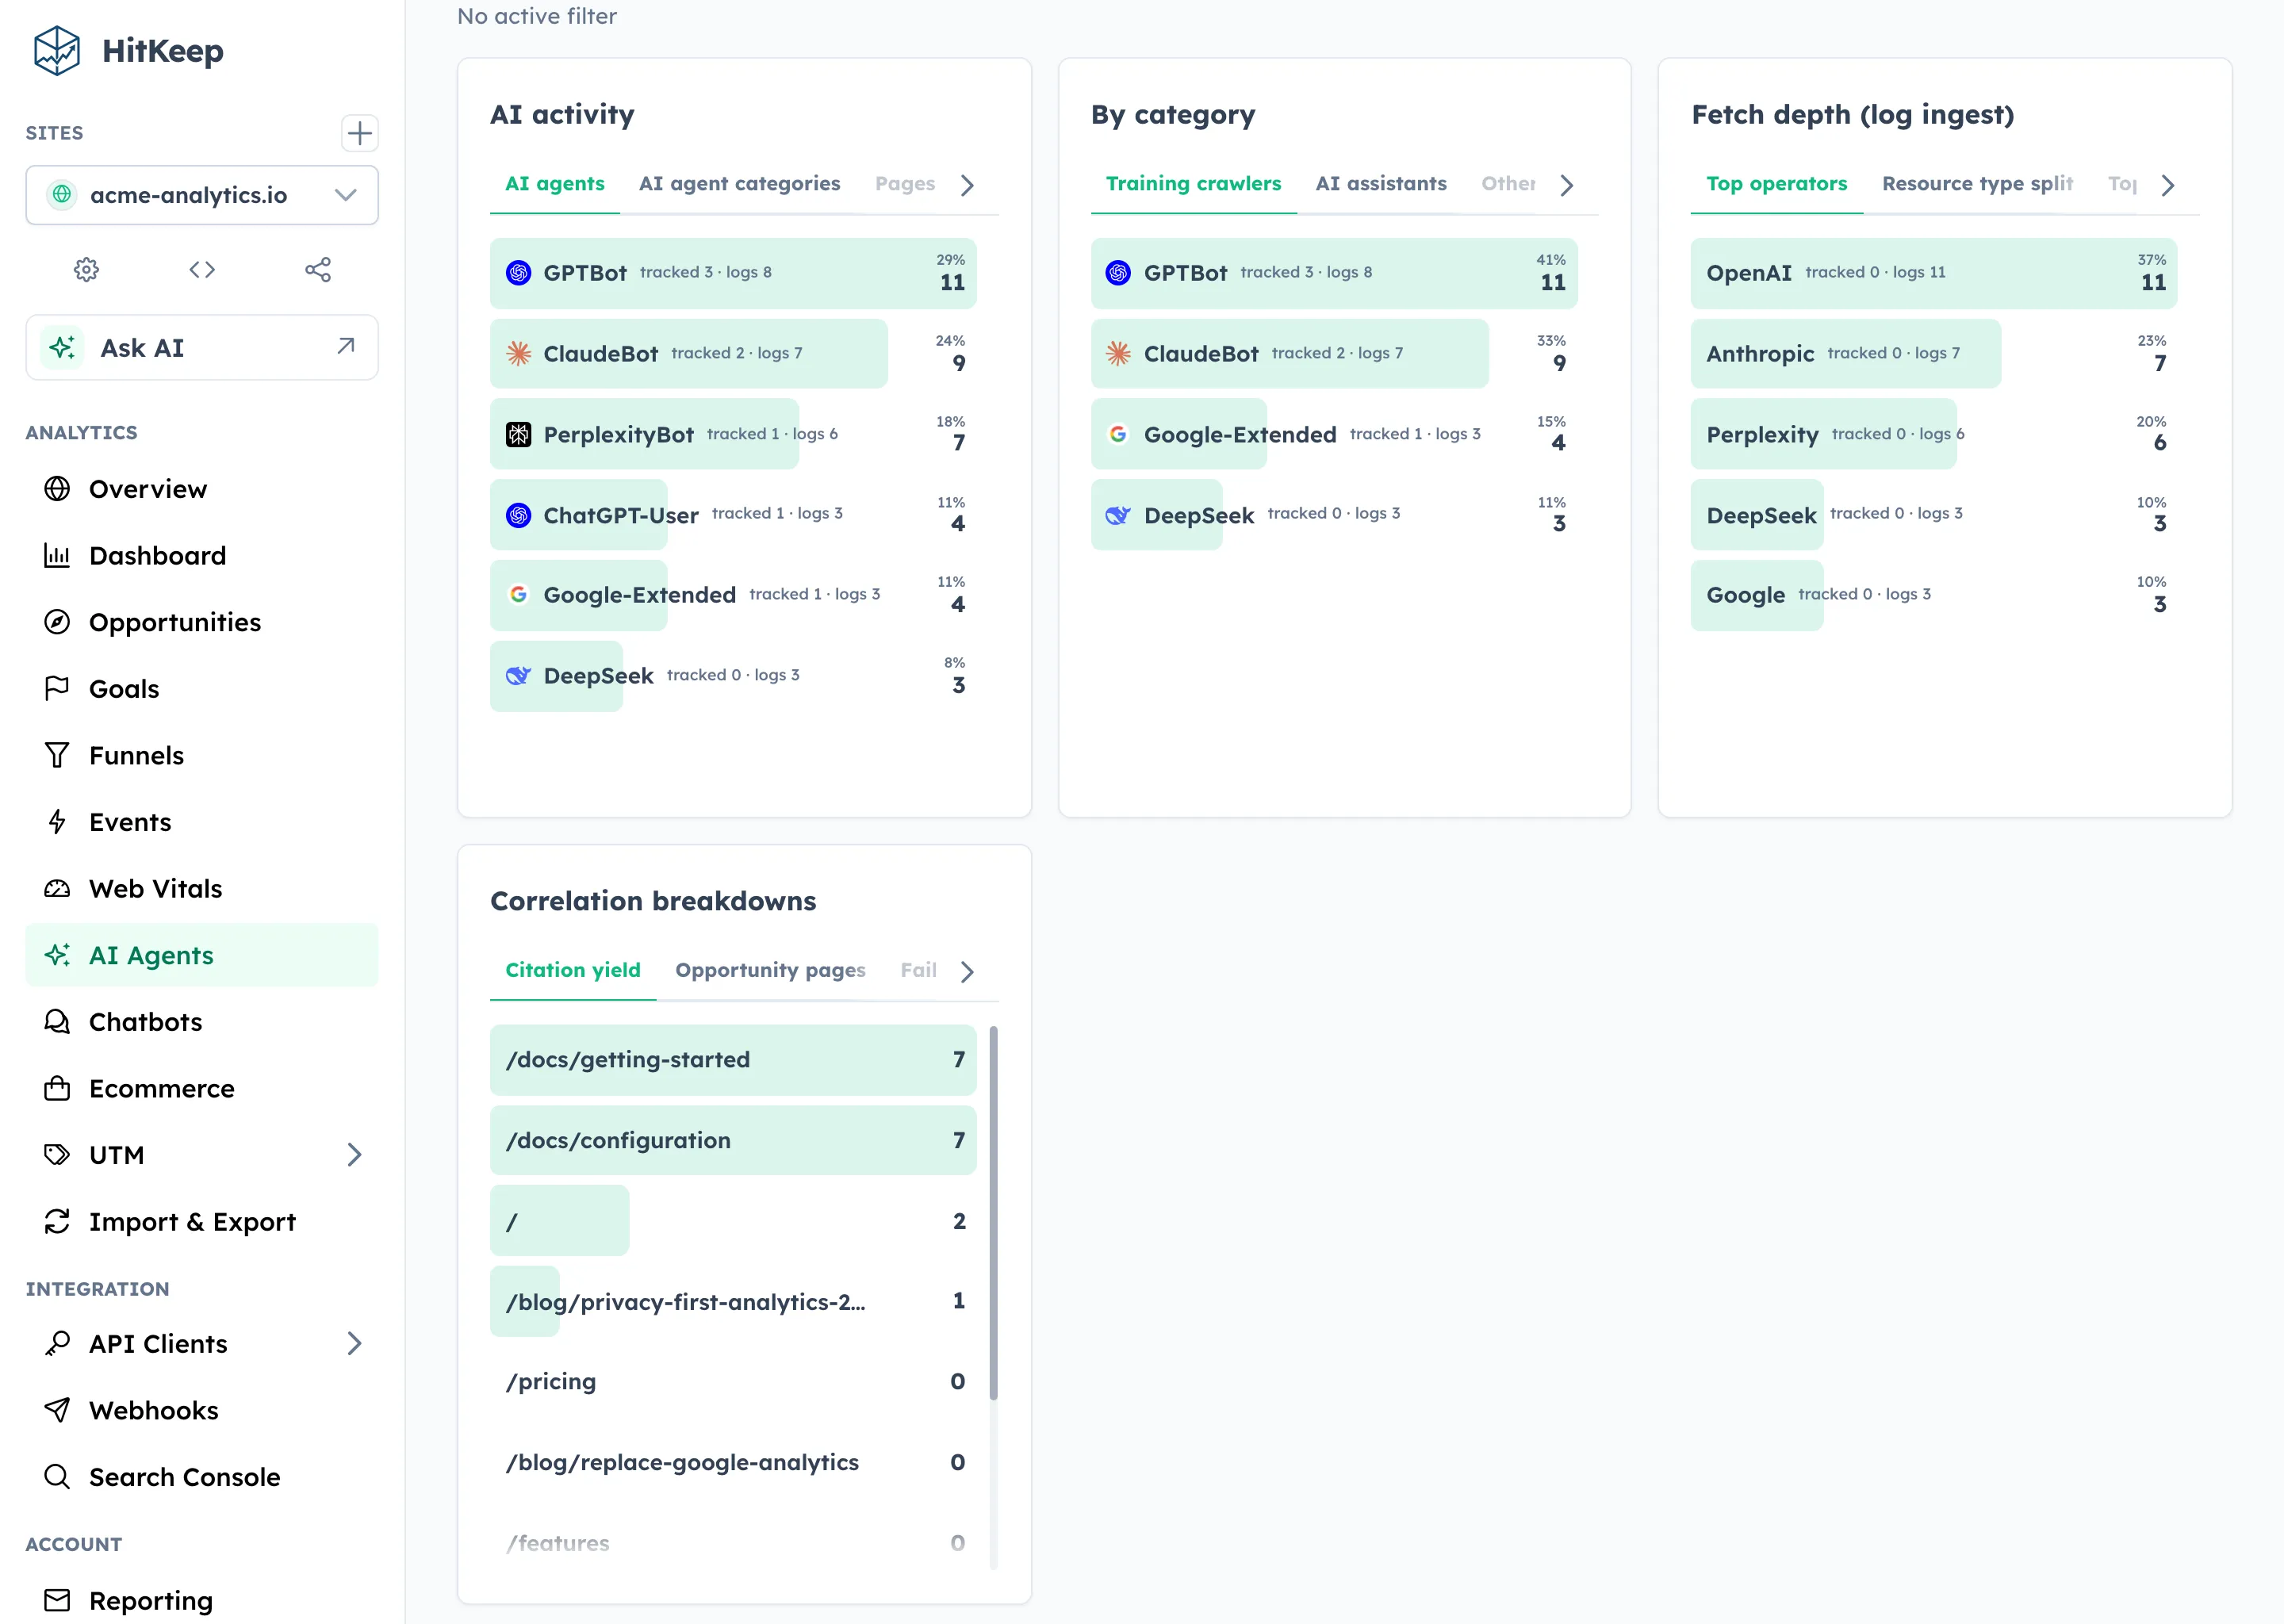
In 2026 reporting, one number is no longer enough. Use three streams and keep them separate:
- Rendered visits: normal browser sessions that executed your tracker.
- AI-referred traffic: visits introduced by AI or assistant referrers.
- AI crawler fetches: requests that may not represent human sessions.
A cleaner report does not combine these into one “AI traffic” total. Keep them distinct and explain what each stream can and cannot prove.
Use recommendation tables, not only raw tables
A useful report should end with action.
| Section | Include | Decision it should support |
|---|---|---|
| Executive summary | 3 wins, 3 risks, 3 actions | Continue, adjust, escalate |
| Goal progress | Actual vs target by owner | Are we on pace? |
| Search visibility | Query mix and click health | Is demand moving correctly? |
| Traffic quality | Source mix and engagement trend | Are we attracting the right audience? |
| Conversions | Goals, funnel health, assisted channels | Where should the team improve next? |
| AI and emerging sources | AI referrals and crawler activity | Is discovery quality changing? |
| Recommendations | Ranked actions with owners | What should happen this cycle? |
The key is restraint. If someone needs deeper detail, provide appendices.
Build a repeatable reporting rhythm
Most teams benefit from two cadences:
- Weekly short updates for execution and operations,
- Monthly stakeholder summaries for interpretation and decisions.
A simple process is enough:
- Review anomalies and tracking changes first.
- Confirm definitions and attribution assumptions.
- Add the recommendation block and owners.
- Publish a short decision summary at the end.
Keep attribution honest
Attribution is useful when its limitations are explicit.
Use first-touch for acquisition understanding, last-touch for closing behavior, and outcome-based context for final recommendations. Do not pretend one metric is “the” truth.
Keep an annotation log
Without annotations, every spike becomes noise and every dip becomes a mystery.
Track campaign changes, tracking config changes, product releases, search updates, consent updates, and major site changes. That log is often the difference between a useful report and a long argument.
Build from one reporting workflow
Teams that switch between GA and privacy-first analytics can still use this framework. The practical requirement is consistency:
- one metric dictionary,
- one reporting cycle,
- explicit source mapping,
- and explicit caveats for AI-mediated and crawler-related behavior.
Need a platform that supports clear reporting with Search Console imports, conversion reporting, AI visibility separation, and open exports? Use HitKeep.